Spark on Yarn and virtual memory error
Recently I wanted to try out some piece of code on Spark using a Docker image. In this image Java-8 is installed (instead of Java-7).
Running spark-shell in yarn mode led to the following error in the shell:
6/12/25 16:56:11 ERROR spark.SparkContext: Error initializing SparkContext.
org.apache.spark.SparkException: Yarn application has already ended! It might have been killed or unable to launch application master.
and in the log file I have observed the following error regarding the virtual memory checker:
Current usage: 304.1 MB of 1 GB physical memory used;
2.2 GB of 2.1 GB virtual memory used. Killing container.
That is indeed a known problem, see for example here, here, here, here.
This problem happens due to the combination of the following points: * glibc>=2.10: Virtual memory footprint of processes has grown a lot since introduction of glibc:2.10 (e.g. in CentOS>=6) due to some new features; memory pool per thread. * Java-8: The above mentioned virtual memory footprint is more pronounced in Java-8 (compared to Java-7) due to Metaspace (which has replaced PermGen). * Yarn: Yarn kills process that exceeds the limits that has been set for the resources it monitors, and Yarn by default monitors virtual memory.
We can resolve the problem by eliminating one or some of the above mentioned points. But before taking the action, let in short have a look at each of these points.
glibc>=2.10 memory pools (Arena)
An arena is a memory pool that is shared between one or more threads from which threads allocate memory. During memory allocation by a thread the arena is locked, so leads to contention over memory allocation in a multi-threaded application. For a nice detailed explanation see here.
From verion 2.10 glibc has introduced a new arena allocator design, which aimed to improve performance of multithreaded processes by implementing per thread memory pool. That means each thread has its own pool that can allocate memory from, so no contention over Memory allocation.
This leads to increase of virtual memory (VIRT in top) footprint. Note that the only resource that is really consumed by these pools is the memory address space. The physical memory (RSS in top) is allocated only when memory allocation is requested by a thread.
In a 64-bit machine the address space is huge. The current implementations supports 256TB (including kernel space). So there should be no worries for this resource to run out. See some additional explanation here.
By default maximum number of arenas in a 64-bit machine is #core * 8.
Each arena has a maximums size of 64MB.
So if you are running you application on a 24 core machine that means the size of virtual memory should be in order of 24 * 8 * 64MB = 12GB.
Even if your application physical memory is just few MB.
The maximum number of Arena can be controlled by the environment variable MALLOC_ARENA_MAX.
Java 8
(Oracle) Java-8 makes the problem above more pronounced than Java-7 due to the fact that PermGen moved into native memory space (i.e. no longer contiguous to the Java heap). And it is called Metaspace.
That means memory allocation in Metaspace it handled by malloc(), consequently a multi-threaded app will end up with multiple arenas being created. More details here here and here.
In order to see the impact of number of arenas on virtual memory, I ran two hello world Java apps, with both openjdk-1.8 and 1.7 with various values for MALLOC_ARENA_MAX. And plotted VIRT and RSS in all cases. The source code I have used to create can found on my github.
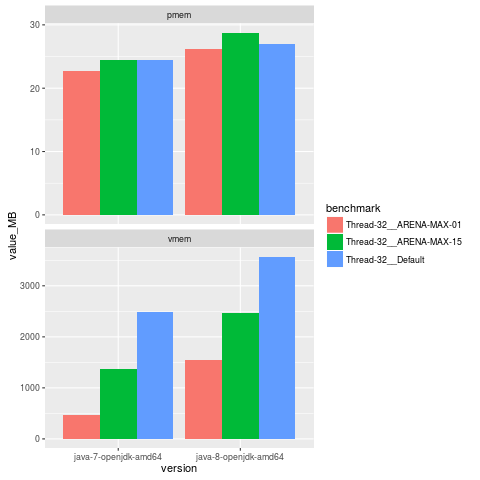
What is illustrated is virtual memory (vmem) and physical memory (pmem)1 (based on ps VIRT and RSS) for various max number of arena, which is controlled by environment variable MALLOC_ARENA_MAX.
Test parameters:
* JVM: java-7-openjdk-amd64 and java-8-openjdk-amd64
* Max number of arenas: 1, 15 and default (which should be 32 as well (#core8 = 48)).
* Threads: 32.
* Max heap size (Xmx): 100 MB.
It can be seen that physical memory (pmem) for Java-7 is around 20-25MB and has not that much variance. Java-8 consumes slightly more memory (slightly more than 25MB) and again not much variance.
However, it is obvious that things are different for virtual memory (vmem). It can be seen that with increasing max number of arena vmem increases as well. Also it can be seen that Java-8 takes around 1GB more virtual memory than Java-7.
Yarn
Yarn kills process that exceeds the limits that has been set for the resources it monitors.
Yarn by default monitors virtual memory,
which is controlled by yarn.nodemanager.vmem-check-enabled,
and the limit is controlled by yarn.nodemanager.vmem-pmem-ratio.
So how to solve the problem?
I talked to much I guess, now let get rid of the error. To resolve the error we can do one of the following:
Set the max number of Arena
Java is different form OS native processes in that Java processes allocate memory from JVM heap. And JVM allocates heap infrequently in large amounts. Therefore, Java apps will not benefit much from arenas as the native processes would.
So we can reduce the number of arena without much problem by setting MALLOC_ARENA_MAX in hadoop-env.sh:
export MALLOC_ARENA_MAX=4It’s been suggested to use values like 2 to 4.
Turn off Yarn vmem check
One other solution is to turn off Yarn vmem check.
<property>
  <name>yarn.nodemanager.vmem-check-enabled</name>
  <value>false</value>
</property>
In most situations vmem in not relevant. As mentioned before it is not a limiting resource in 64-bit machines.
Also consider increasing yarn.nodemanager.vmem-pmem-ratio which by default is 2.1.
See
here and
here for some other best practices for Yarn resource management.
Use Java 7
One option would be to use Java-7 instead of 8. In some cases that might help.
Footnotes
-
Physical memory is defined based on RSS. RSS is the Resident Set Size and only represents the amount of memory allocated which is in RAM, but not in SWAP. It also includes shared libraries which are currently loaded and are in RAM. On the other hand what we see here is the size of heap, which is not necessarily reflects the amount of memory is allocated for the Java threads. ↩